
Last quarter, an automation manager walked into a leadership review with a clean slide.
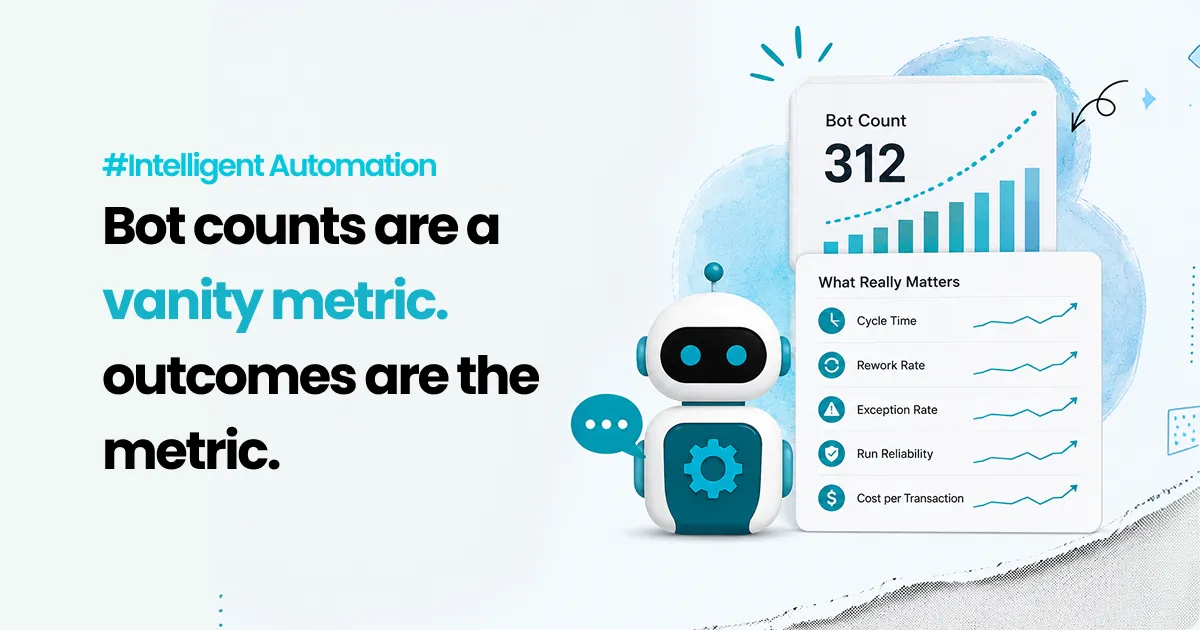
“312 bots live.”
“64 processes automated.”
“1,400 hours saved.”
The room nodded. Someone even smiled.
Then the operations lead asked the only question that mattered.
“Great. So what changed for the customer and the team?”
Silence. Not because the programme had failed, but because it had been measured like a hobby. Lots of activity, very little proof of impact.
That is the trap with robotic process automation (RPA). Bot counts feel like progress because they are easy to count. Outcomes are harder, because they require you to state what problem you were solving, which workflow it lives in, what the baseline was, what changed, and what stayed messy.
This is not a niche failure. In September 2024, Gartner reported that fewer than 20% of organizations had mastered the measurement of hyperautomation initiatives. Frances Karamouzis, the Distinguished VP Analyst quoted in that release, tied the problem to scope: these programmes sit inside a much larger technology roadmap, so the measurement question is rarely owned by anyone in particular. Two years on, most of the automation reviews we sit in still open with a bot count.
This post is a practical way out of that.
You will get the five metrics that actually tie to return on investment (ROI), what to measure when humans stay in the loop, a worked ROI model with the arithmetic filled in, and the point at which that model stops working.

Why bot counts mislead smart teams
Bot counts measure output from the automation team, not outcomes for the business.
A single bot can be tiny, copying two fields between systems, or it can close an end-to-end case across fou2r systems. Counting both as “1 automation” is like counting “1 meeting” without caring whether it decided anything.
Bot counts also hide three uncomfortable truths.
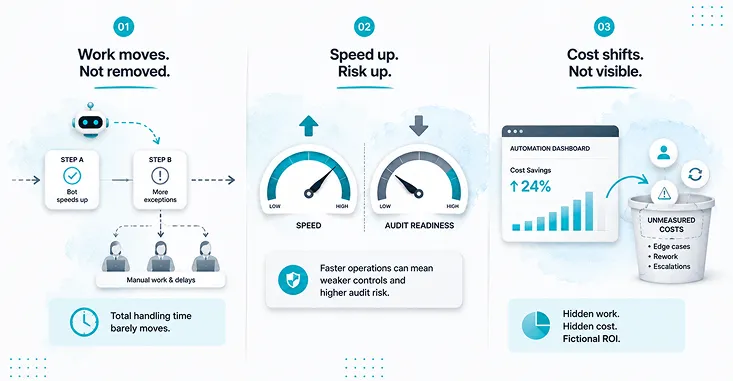
Automation can move work rather than remove it. A bot speeds up step A and generates more exceptions at step B. Total handling time barely moves. The customer still waits.
Automation can increase risk quietly. If a bot takes decisions without strong logging, approvals and access controls, you become faster and less audit-ready at the same time. Worth noting that the standard reference here, NIST Special Publication 800-92 on log management, was published in 2006, and a revision has been sitting in draft since October 2023. If your audit posture depends on it, read the draft rather than the twenty-year-old final.
Automation can shift cost into places you are not looking. People still absorb edge cases, rework and escalation. If you do not measure that work, your ROI number is fiction.
So measure the workflow, not the bot.
The five metrics that actually tie to ROI
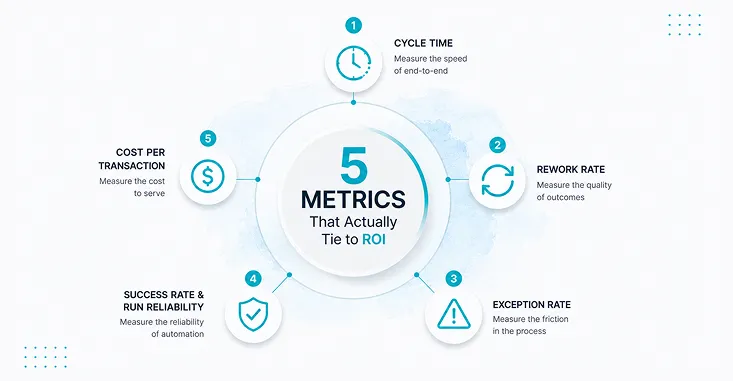
ROI comes from four things: speed, quality, cost and risk. Five metrics map onto them. Each one below gets the same shape, deliberately: a definition, a formula, what to break it down by, and the failure mode it exposes.
1. Cycle time
Definition. Time from request start to request completion, end to end. Not bot runtime.
Formula. Completion timestamp minus request timestamp, per request type.
Break it down by: request type, and by percentile. Track the median (p50) and the 90th percentile (p90), not the average. The average hides the long tail, and the long tail is what generates complaints.
Failure mode it exposes. A bot finishes in nine seconds while the case takes two days, because it sits in a queue waiting for a human decision. Track only bot runtime and you will celebrate a system that is still breaching its service level agreements (SLAs).
2. Rework rate
Definition. The share of cases that come back because they were done incorrectly or incompletely.
Formula. Cases returned for correction divided by total cases.
Break it down by: cause. Missing data, wrong routing, wrong status update. Three causes usually account for most of it.
Failure mode it exposes. Rework burns the same case twice and usually crosses teams, so it rarely appears in any one team’s numbers. Reducing it is real money, unlike “hours saved.”
3. Exception rate
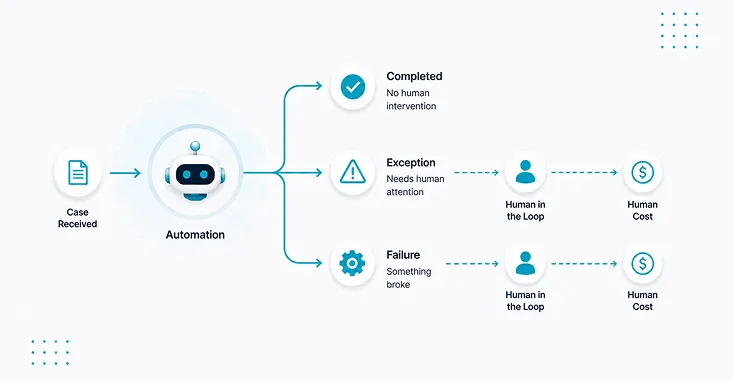
Definition. The share of cases the automation cannot complete and hands to a human.
Formula. Exceptions divided by total volume.
Break it down by: workflow, reason code, system dependency, and by type, which the next section covers.
Failure mode it exposes. This is the most honest metric you can track, because it measures friction rather than effort. It is also the one most often left out of the business case.
4. Success rate and run reliability
Definition. How often automation runs complete as designed, and how quickly you recover when they do not.
Formula. Completed runs divided by total runs. Alongside it, mean time to recover.
Break it down by: failure cause. System errors, data issues and rule gaps have different owners.
Failure mode it exposes. Unreliable automation creates operational drag that never appears as a cost line. Reliability also determines whether you can safely scale, so this metric governs your roadmap more than your ROI.
5. Cost per transaction
Definition. Total cost to process a request class, divided by requests handled.
Formula. (Human time cost + automation run cost + support and maintenance + exception handling) divided by total requests.
Break it down by: before and after, for the same request class. Comparing different classes proves nothing.
Failure mode it exposes. This is the one metric leadership understands without translation. It turns automation from an activity report into unit economics.
What to measure when humans stay in the loop
Humans do not disappear. They supervise, approve and absorb everything the rules did not anticipate. That work is where automation programmes quietly lose the savings they claim.
Two things are worth knowing before you build this view.
Your platform distinguishes between kinds of failure, and so should you. Microsoft’s Power Automate documentation separates business exceptions, meaning the process met a case it was not designed for, from generic exceptions, meaning something broke. These have different owners and different fixes. A rising business exception rate means the workflow was scoped wrong. A rising generic exception rate means you have an engineering problem. Collapse both into one number and you learn that something is wrong, but nothing about what.
Check how mature the telemetry is before you depend on it. In Microsoft’s current documentation, success rate, run count and duration are generally available. The work queue metrics that actually describe human cost, including business exceptions, generic exceptions, time in queue, SLA violation and SLA at risk, are marked public preview. The metrics you most need in order to defend an ROI number are the least settled part of the platform. Reconcile them against your own case data instead of screenshotting a dashboard into a board pack.
Then measure four things.
- Exception handling time, split in two. Time waiting in a queue before a human picks the case up, and time from pickup to resolution. The first is usually larger and almost nobody tracks it. This is precisely where fast automation becomes slow customer experience.
- Cost per exception. Fully loaded cost of one human intervention. If it exceeds the cost of the original manual workflow, and it often does, every exception is a case you would rather not have automated.
- Exception trend over time. It should fall as rules are tuned. Flat after two quarters usually means the use case is wrong rather than under-tuned. Treat a stubborn exception rate as a scoping verdict, not a backlog item.
- What humans catch. Corrected errors as a share of total errors. This frames the human layer as quality control rather than leftover cost, and it is the number that protects your team in a headcount conversation.
A worked ROI model your operations lead will accept
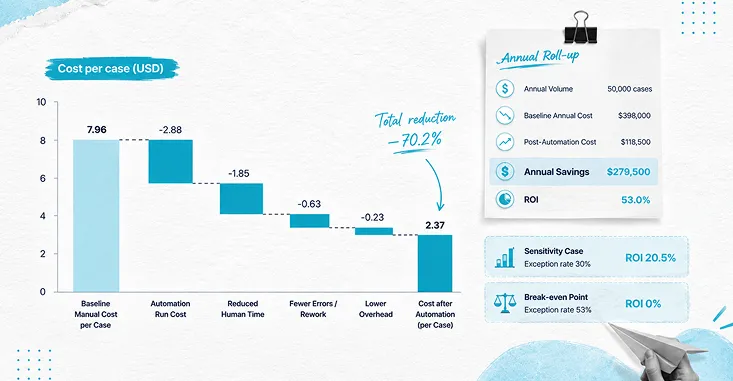
Operations leads trust models that are conservative, auditable, built on real baselines, and tied to one workflow. Here is one filled in end to end.
Every figure below is illustrative. Substitute your own. What matters is the shape of the calculation and the fact that it survives being checked.
Result. Net benefit $28,597. ROI is 28,597 divided by 52,000, or 55%. Payback 7.7 months.
Add quality and risk savings only if you can defend them in dollars. Fewer compliance exceptions, fewer customer-impacting errors, fewer escalations. If you cannot defend the number, keep it as a separate “risk reduced” narrative. Do not manufacture a figure.
Now the two paragraphs most models leave out.
If the exceptions are worse than you assumed. Hold everything else and move the exception rate to 30% at 12 minutes each. Residual human time rises to 5.55 minutes, cost per case to $3.61, saving to $4.35. Gross benefit $62,645, net $10,645, ROI 20.5%. Still positive, and less than half of what you presented.
Where it dies. Working backwards, the programme breaks even at roughly 4.77 exception-minutes per case, which at 9 minutes per exception is a 53% exception rate. Above that, you are paying to run a process that costs more than the manual version did.
Put that last number on the slide. It tells leadership what has to be true for your business case to hold, instead of asking them to trust that it does. Do this for three workflows and you have a portfolio story rather than an anecdote.
When the number improves and the experience gets worse
Every metric section above says why the metric ties to ROI. Here is the other half, because a measurement discipline that only ever confirms your business case is not a measurement discipline.
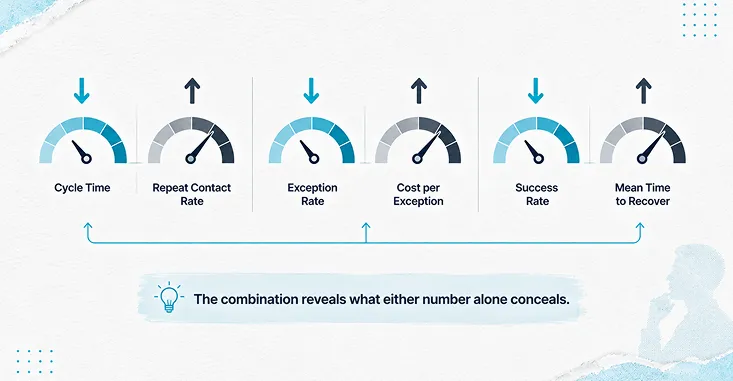
The pattern we see most often: cycle time drops, and repeat contacts rise. The automation closes the case correctly and quickly, but without the explanatory step a human used to add, so the customer does not understand what happened and gets back in touch. Cycle time, taken alone, records that as a win. Cost per transaction records it as a loss two weeks later, in a different queue, usually owned by a different manager.
There is a harder version. One of our long-running engagements, a European logistics operation handling around 20,000 unstructured customer service emails a month, ran into it during scoping: the workflow that looked most automatable was load-bearing for compliance evidence. Automating it would have improved every operational number on the dashboard while degrading the audit trail the business actually depended on. The right answer was not to automate it the right answer was not to automate it.
And then the case we keep coming back to. We ran automation for Thomas Cook, and it returned three euros for every euro invested, certified by their own finance function. That number was real and it was audited. In September 2019, the 178-year-old company went into compulsory liquidation, stranding around 600,000 customers mid-travel and costing roughly 21,000 jobs. The UK National Audit Office published an investigation into the government’s response the following March.
Our automation programme was not a cause of that collapse, and nothing in the measurement was wrong. That is precisely why we keep telling the story. A perfectly measured three-to-one return on a well-chosen workflow tells you that one workflow got better. It tells you nothing about whether the business is viable. Automation ROI is necessary and not sufficient, and any consultant who implies otherwise is selling you something.
So pair every metric with its counter-metric. Cycle time with repeat contact rate. Exception rate with cost per exception. Success rate with mean time to recover. If a metric can only move in a direction that flatters you, it is not measuring anything.
Who verifies the denominator
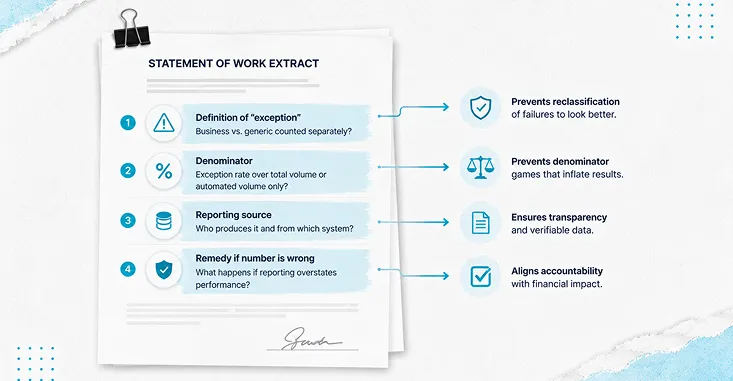
One question decides whether any of this survives contact with a vendor relationship: who defines the terms, and who checks them?
Before you sign, get four things in writing.
The definition of “exception,” and whether business and generic exceptions are counted separately. If they are pooled, the number can be improved by reclassifying failures rather than fixing them.
The denominator, stated explicitly. Exception rate over total volume, or over automated volume only? The second definition makes any programme look better, and it is the one most often used without being named.
Who produces the number, and from which system. If it comes from a vendor dashboard, and the underlying metrics are in preview rather than generally available, agree how it gets reconciled against your case data.
What happens when the number is wrong. This is the clause nobody writes. If reporting overstates automation performance for a quarter, does anything happen to the invoice? Agree it before you need it.
For what it is worth, we will redo work at our own cost when it is not right. That commitment only means something if both sides agreed in advance how “right” would be measured.
What your dashboard should look like
Two views, because executives and operators need different things.
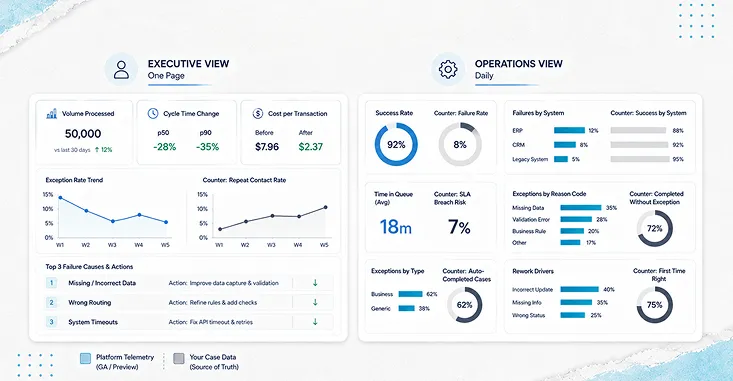
Executive view, one page. Volume processed. Cycle time change at p50 and p90. Cost per transaction, before and after. Exception rate trend. Top three failure causes and what is being done about each. This is where you win trust, and the fifth item is what earns it.
Operations view, daily. Success rate and failures by system. Time in queue and SLA breach risk. Exceptions by reason code and by type. Rework drivers. This is where you protect performance.
One rule for both: show the counter-metric next to the metric. A dashboard where every number can only be good news is a marketing asset, not an instrument.
The final mindset shift
The unit of value is the workflow, not the bot.
That is the whole argument, and it has a test attached. If you can state, for one workflow, what the baseline was, what the number is now, what it cost to get there, and the condition under which the business case fails, then you are measuring. If you can only state how many bots are live, you are reporting activity.
Gartner’s under-20% figure is two years old now, and in that time the tooling has improved considerably while the measurement discipline has not moved much. The constraint was never the platform.
So the next time someone asks how many bots you built, answer politely.
Then open the dashboard that shows what changed, and the one number that would prove you wrong.
If you ran the breakeven calculation on your own highest-volume workflow tomorrow, do you already know which way it would come out?