

Two people can use the phrase “emotion recognition” in the same meeting and mean incompatible things.
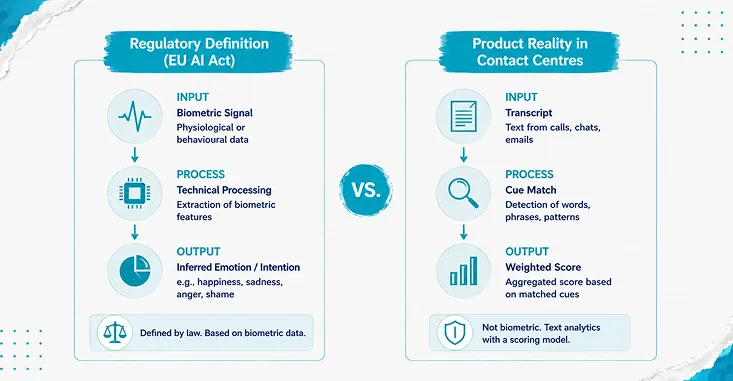
Under European law it has a narrow, technical meaning. Regulation (EU) 2024/1689, the European Union’s AI Act, defines an emotion recognition system as one that infers emotions or intentions on the basis of biometric data, and biometric data means data resulting from technical processing of physical, physiological or behavioural characteristics. The recitals draw the line further in. The concept covers emotions such as happiness, sadness, anger and shame, and expressly excludes physical states such as pain or fatigue, along with the “mere detection of readily apparent expressions.”
Inside a contact centre platform, the thing on the dashboard is usually something else entirely. It reads the transcript. It looks for words and phrases. It scores them.
Those are two different systems, with two different failure modes and two different regulatory positions, and the gap between them is where most emotion-analytics programmes go wrong. Not because anyone lied, but because the buyer bought the first definition and got the second.
This piece works through what the score is actually made of, what a wrong score costs, and the accuracy level below which the whole exercise loses money.
Claim one: “it hears the frustration in their voice”
Check this one first, because it is the claim buyers repeat internally and the one most likely to be false.
NICE’s own Key Terms and Metrics documentation for Interaction Analytics (CXone) states it twice, unambiguously. Of sentiment: “Sentiment scores are not influenced by voice characteristics, such as tone, volume, and speed.” Of frustration: “Frustration cues are not influenced by voice characteristics, such as tone, volume, and speed.” That is the platform partner describing its own product the platform partner describing its own product.
So the score is a language score. It matches cues in the transcript, phrases such as “I want to speak to your manager,” “This is the third time I’ve called,” “I’m sick and tired of this,” “I’m not happy about the delay.” A customer who says none of those things in a flat, resigned voice scores neutral. A customer who says all of them cheerfully scores frustrated.
Three consequences follow directly, and none of them are visible in a demo.
The transcript is the ceiling. Everything downstream inherits speech recognition quality. Where recognition confidence is low on a given call, the cue match degrades before the score does, and the score does not report that it happened. This is the same dependency chain that governs automated call summaries automated call summaries, and it fails in the same direction.
Frustration and sentiment are not the same instrument. Per the same documentation, frustration measures cues for the client only, while sentiment can measure cues for both the client and the agent. The relationship between them is asymmetric: all frustrated interactions should also be negative, but negative sentiment does not always correlate with frustration. Treat the two as interchangeable in a report and you produce numbers that cannot be reconciled with each other.
The window matters more than the score. Beginning Sentiment is determined by the first 400 words or the first 30% of the interaction, whichever comes first. End Sentiment is determined by the last 30%. Neither can return a Mixed value. A call that opens badly and ends well produces a specific pair of values, and a report that averages them has destroyed the only interesting thing in the data.
Claim two: “the number tells you the customer is angry”
It tells you cues appeared and were weighted. Those are different statements.
Sentiment is calculated by applying specific weights to each cue, described in the documentation as overwrite, strong, weak and yield. An interaction can therefore be categorised as Mixed even when the raw count of one cue type is significantly higher than the other. The score is not a tally. Anyone who builds a report on the assumption that more negative phrases produce a more negative score will find cases that contradict them and will have no way to explain why.
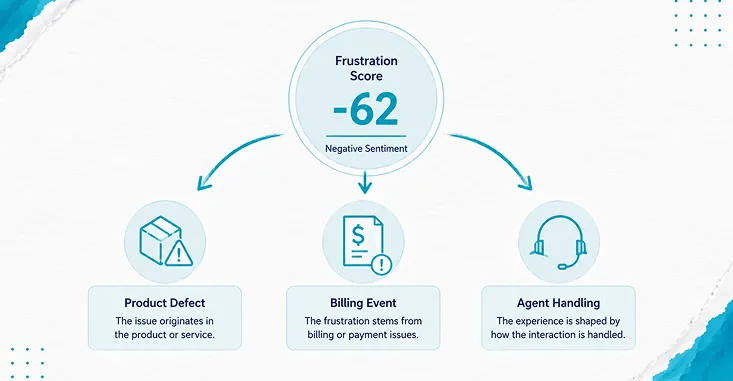
The documentation is also honest about attribution in a way internal reporting rarely is. Negative sentiment does not have to mean there is a problem with agent performance or behaviour. It can stem from a product issue, a billing challenge, or an event entirely outside the agent’s control.
That single sentence should govern how the metric is allowed to be used. A frustration score attached to an agent’s name, on a dashboard a team leader reviews weekly, is substantially a measurement of the queue that agent was given.
Independent research points the same way. In work presented at the 2021 Affective Computing and Intelligent Interaction conference, researchers from Microsoft and Stanford observed that tools traditionally used by domain experts are now used by individuals often unaware of the technology’s limitations and in potentially harmful settings, and proposed twelve guidelines for systematically assessing and reducing that risk. The most useful one for a contact centre is also the least technical: be explicit about what the output is not evidence of.
Claim three: the honest arithmetic of a false flag
A frustration flag has no value on its own. Value appears only when someone does something differently because of it, and the doing costs money whether or not the flag was correct.
So the useful model here is not a savings model. It is a model of what it costs to be wrong, and how often you can afford it.
The scope, stated tightly
The figures below are illustrative. They are shaped to be plausible rather than taken from any engagement, and the labour costs and licence share are market-shaped assumptions rather than price-list entries. Substitute your own numbers. What is being demonstrated is the shape of the calculation and the thresholds it produces, not the result.
One line of business. 40,000 inbound interactions a month, 6% carrying frustration cues, so 2,400 flagged interactions. Every flagged interaction gets a four-minute analyst review before anyone acts on it. Confirmed cases get a twelve-minute outbound save attempt from a senior agent. False flags are not free: roughly 30% of them surface in a coaching conversation before someone establishes the flag was wrong, at about fifteen minutes of a team leader’s time.
Labour is costed over productive hours rather than paid hours. 2,080 paid hours less 28% shrinkage gives 1,497.6. Fully loaded, that is $34.72 an hour for the quality analyst, $30.72 for the senior agent, and $38.73 for the team leader. Governance work costs more per hour than the work it governs, which is why a single blended rate flatters this kind of case.
On the value side, 70% of confirmed cases get actioned inside a window where it still matters, 22% of save attempts retain the customer, and a retained customer is worth $95 in annual gross margin. Analytics licence share is $2,100 a month, and $24,000 of configuration and first-cycle tuning amortised over 36 months adds $667.
Two accuracy levels, side by side
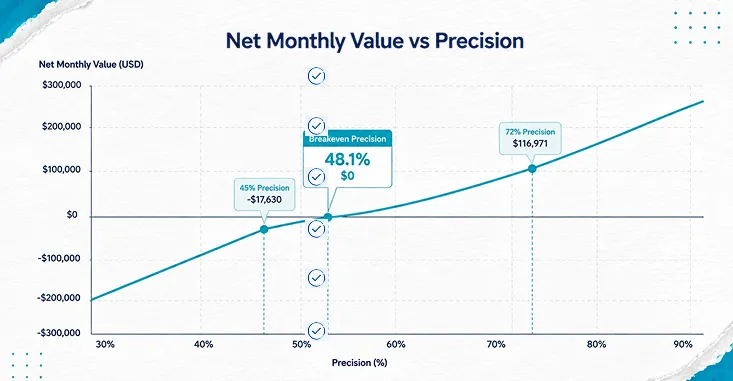
At 72% precision, meaning 72% of flags are correct, after the cue lists have been tuned to the business:
- 1,728 true flags and 672 false ones
- 1,209.6 actioned cases, producing 266.1 retained customers
- Cost: $5,555.56 review, plus $7,430.77 outreach, plus $1,951.92 coaching drag, plus $2,766.67 licence and amortised build, giving $17,704.91 a month
- Value: $25,280.64. Net $7,575.73. Return on investment 42.8%
At 45% precision, which is a realistic figure before any cue tuning has been done:
- 1,080 true flags and 1,320 false ones
- Review cost is unchanged at $5,555.56, because you review every flag regardless of whether it turns out to be real
- Outreach falls to $4,644.23, because there are fewer genuine cases to work
- Coaching drag rises to $3,834.13
- Cost: $16,800.59. Value: $15,800.40. Net minus $1,000.19. Return on investment minus 6.0%
Read those two together, because the comparison is the point. Total cost went down by $904.32 while the programme went from profitable to loss-making. The cheaper configuration is the one that loses money, because the mix shifted out of productive outreach and into unproductive review and coaching.
The three numbers to put in front of leadership
Breakeven precision: 48.1%. Below roughly one flag in two being correct, this programme destroys value. Solved by bisection and confirmed algebraically.
Breakeven realisation: 40.3%. At 72% precision, if fewer than 40.3% of confirmed cases are actioned inside the useful window, the case dies. Insight is not money until someone acts on it, and the acting has to happen while the customer still cares.
Breakeven save rate: 15.4%. Move the retention rate on save attempts from 22% down to a pessimistic but plausible 15% and the whole thing lands at minus 2.6%. That is the most fragile assumption in the model and the one least likely to be measured anywhere.
Three thresholds, all measurable inside your own operation, none of which require anyone to trust a vendor’s number. That is why they belong on the slide rather than in an appendix.
Claim four: where the score improves and the outcome gets worse
There is a specific mechanism by which this programme succeeds on its own dashboard while service gets worse, and it follows directly from a documented design choice.
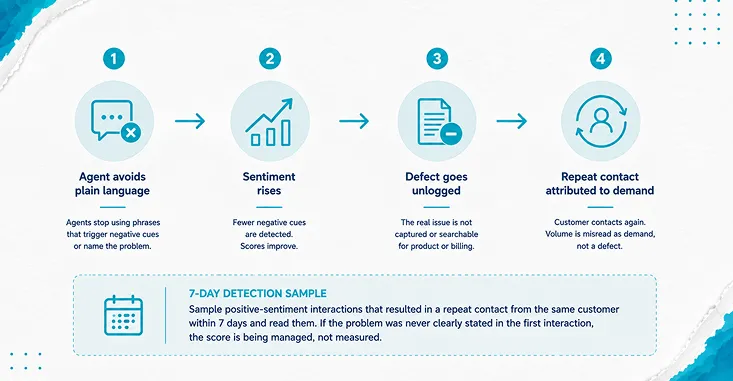
Sentiment measures cues for the agent as well as the client. Agents work that out quickly. What follows is cue suppression. Agents stop using plain language that triggers negative cues. They stop saying “that is a system error on our side.” They stop naming the problem at all. Interactions get smoother, sentiment climbs, and the underlying defect goes unrecorded, because nobody wrote the words that would have made it searchable later.
The cost lands two teams away and several weeks later: in the product or billing team that never receives the signal, and in repeat contact volume that gets attributed to demand rather than to a defect nobody logged.
How to detect it. Sample interactions with positive End Sentiment that produced a repeat contact from the same customer within seven days, and read them. If the first contact contains no plain statement of the problem, the score is being managed rather than measured. Run that sample before the programme goes live, so the baseline predates the incentive.
There is a second, quieter version of the same problem. A save attempt is an outbound contact triggered by an automated read of a private conversation. For a customer who was mildly irritated and has since moved on, that call is not empathy. It is surveillance with a script. False positives do not only cost twelve minutes of a senior agent’s time. Some of them cost goodwill, and that cost stays out of the arithmetic above deliberately, because no defensible figure exists for it. It belongs in the decision as a reason to hold the threshold high, not as a line item.
Claim five: “it is analytics, so it is not regulated”
This is where the definitional gap at the top of the piece stops being pedantic.
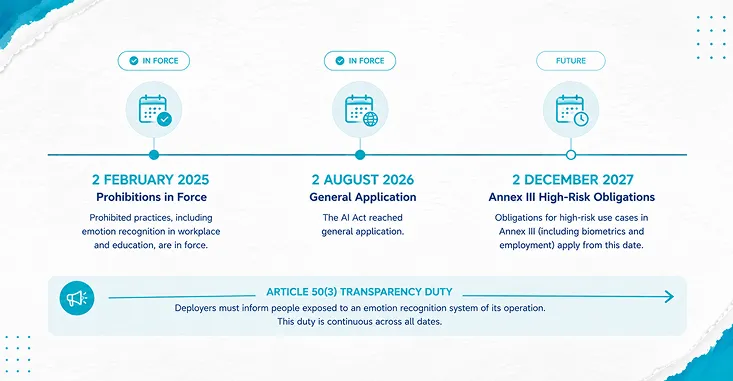
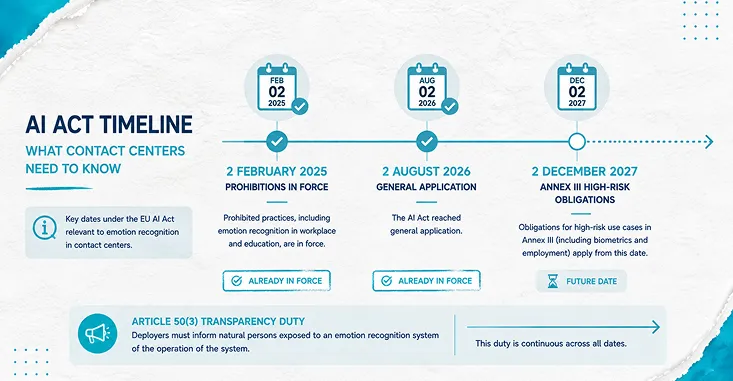
The AI Act prohibits the use of AI systems to infer emotions of a natural person in the areas of workplace and education institutions, except where the system is intended for medical or safety reasons. That prohibition is not a future compliance date. Per the European Commission’s own AI Act guidance, the prohibited practices entered into application on 2 February 2025, and the Regulation reached general application on 2 August 2026. Both dates have passed.
One date has moved, and in the opposite direction to what most compliance calendars assumed. The obligations attaching to high-risk use cases in the sensitive areas listed in Annex III, which include biometrics and employment, were pushed back to 2 December 2027 by the amending regulation known as the AI Omnibus, which entered into force on 27 July 2026. That is breathing room on the high-risk obligations. It is not breathing room on the prohibition, which has been live for eighteen months.
Three things a contact centre buyer should take from that.
“Workplace” includes the people wearing the headsets. The prohibition concerns inferring the emotions of natural persons in a workplace context. A system scoped to customers is one thing. A system that also scores the agent’s cues, which sentiment does by design, is a system operating on employees. That is a configuration decision to settle before go-live rather than after.
Scope turns on the definition, not the label. Both the prohibition and the high-risk classification attach to emotion recognition anchored in biometric data. Whether a transcript-based cue-matching score falls inside that definition is a real legal question, and it is one about your specific configuration rather than about the product category. It needs a written position from qualified counsel, describing the configuration as built, revisited whenever the configuration changes. This piece does not answer that question and no platform vendor can answer it on your behalf. What matters operationally is that somebody has answered it in writing, and that the answer is dated, because the Annex III timing has already changed once.
Where emotion recognition is permitted, transparency is still owed. Article 50(3) requires deployers of an emotion recognition system to inform the natural persons exposed to it of the operation of the system. That duty sits with the contact centre as deployer, not with the platform vendor. It changes call scripts, interactive voice response messaging and privacy notices, and it is the obligation most often discovered late.
The Regulation’s own reasoning is worth reading before anyone builds a business case on this technology. Recital 44 records “serious concerns about the scientific basis of AI systems aiming to identify or infer emotions,” naming as key shortcomings “the limited reliability, the lack of specificity and the limited generalisability.” A legislature has written down, in the operative reasoning of the law, that these systems may not work as well as claimed. That is the single most useful sentence available to anyone negotiating a contract for one.
What the quarterly review has to contain
The statement of work gets all the attention. The quarterly business review is where a metrics programme quietly stops being true, and almost nobody specifies its contents in advance.
Four items, agreed before go-live, produced by the platform team rather than by the vendor.
The precision audit. A stated number of flagged interactions sampled since the last review, read by a human, with the confirmed and false split and the resulting precision figure. Not a sentiment trend. Precision, set against the breakeven you agreed. If it comes in under 48%, the tuning conversation happens at that meeting rather than at renewal.
The cue list changelog. Custom cue configuration is where the score is really set. The vendor documentation’s own example is that the word “cancel” is neutral by default, but you may want it treated as negative if you are concerned about customers cancelling a service. Every change to that list changes the historical comparability of every chart in the pack. The changelog records who changed what, when, and what the trend looked like on both configurations.
The action record. How many confirmed cases were actioned inside the window, by whom, and what happened next. This is the realisation number, and it is the one that fails silently, because no job description says “own the flag.”
The disagreement log. The cases where the human reviewer and the score disagreed, kept as text rather than as a count. This is the only artefact in the pack capable of telling you that the model has drifted, or that the business has changed and the cue list has not.
A review pack that cannot produce those four means the programme is being reported on rather than managed. The same gap shows up across implementation programmes generally across implementation programmes generally, and it is usually why a technically sound build stops delivering by month five.
The one place the flattering number and the true number diverge
Instead of a list of paired metrics, here is the single case to watch for, because it occurs in nearly every deployment and it always looks like progress first.
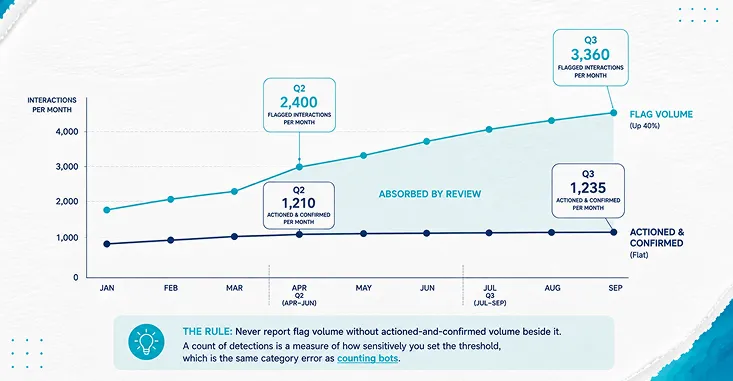
Quarter two: 2,400 flagged interactions a month. Quarter three: 3,360. Flag volume up 40%. Sentiment coverage is up, more of the estate is instrumented, the dashboard is greener, the programme reports progress.
Now the second number. Confirmed cases actioned inside the window: 1,210 a month in quarter two, 1,235 a month in quarter three. Flat.
Both numbers are true. Read together they say something the first cannot: precision fell, the analyst team absorbed 960 extra interactions a month at a review cost of $2,222.22, and the save motion is capacity-bound rather than signal-bound. The programme did not get better. It got noisier, and someone quietly paid for the noise.
The rule that follows generalises past this metric: never report flag volume without actioned-and-confirmed volume beside it. A count of detections is a measure of how sensitively you set the threshold, which is the same category error as counting bots the same category error as counting bots.
What this looks like as implementation work
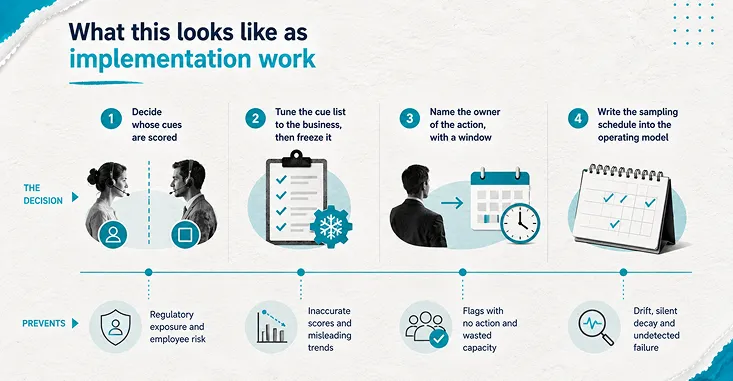
Stripped of the language about empathy, the build comes down to four decisions.
None of that is exotic, and none of it is where deployments usually fail. They fail because the flag went live, the dashboard populated, everyone agreed it looked useful, and nobody costed the false positives. That pattern is common enough across CXone programmes to have a recognisable shape a recognisable shape.
The underlying demand, incidentally, is real. A global survey of nearly 12,000 consumers across eleven countries, reported in Harvard Business Review by Stanford psychologist Jamil Zaki and Zurich Insurance Group chief customer officer Conny Kalcher, found that empathy mattered more to purchasing decisions than reviews or recommendations, while 78% of respondents said businesses do not genuinely care about them. Customers want to be understood. The open question is whether a cue-matching score is the instrument that delivers that, or the thing an organisation deploys instead of delivering it.
Where to start
Pick one line of business. Pull 100 interactions the system flagged as frustrated last month and read them. Count how many you would have escalated.
That number is your precision. Set it beside 48.1% and you know whether you have a programme or a dashboard, and you know it before spending anything further. The same one-workflow discipline applies here as everywhere else in contact centre automation everywhere else in contact centre automation.
Then the harder question, and the one that decides whether any of this lands. If the flag started firing correctly tomorrow, and 1,200 confirmed cases a month each needed a twelve-minute call inside a window that matters, what would your team have to stop doing in order to make those calls?
If there is no answer to that, accuracy was never the constraint.