Author name: Martijn Zuiderbaan

VP of Cloud, Data and AI

The Most Common Challenges In Ai And Automation Implementation - Pateam Blog
Blog

The Most Common Challenges in AI and Automation Implementation

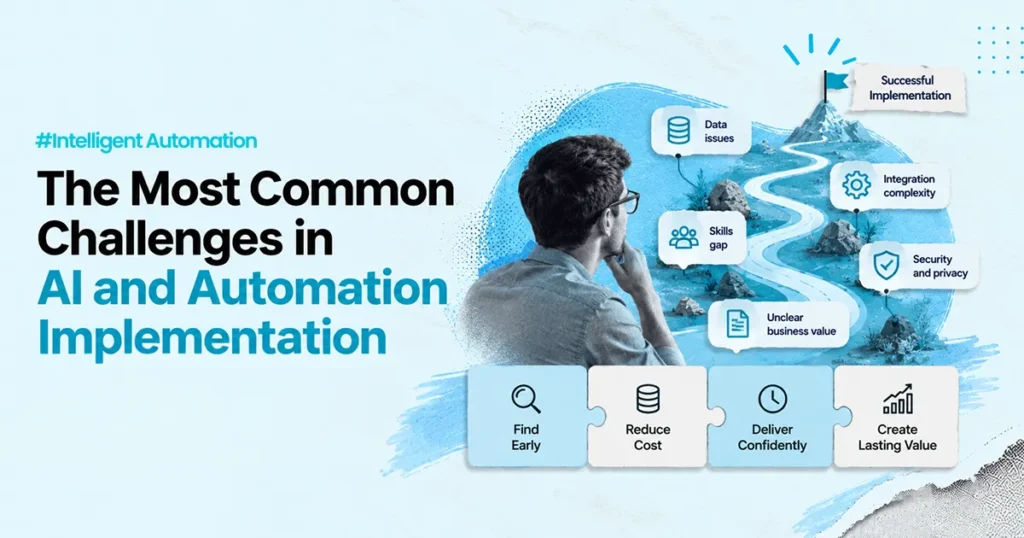
Most AI and automation projects do not fail because the idea was bad. They fail because the system cannot survive real operations. A common story looks like this. A team builds a working pilot in a few weeks. The demo looks great. Leadership is excited. Then the same pilot hits production and everything slows down. Data is missing. Exceptions show up. Security asks hard questions. The business is unsure who owns it after go-live. Adoption is patchy because the workflow is not inside the tools people already use. If you are planning AI or automation, this is the article to read before you spend your budget. This guide explains the most common problems teams run into, why they happen, and what to do instead. It uses simple language and practical steps. No hype. First, a simple definition (so we stay clear) Automation means software follows steps you define. Example: “If the status is Approved, then create a ticket and send an email.” RPA (Robotic Process Automation) is a type of automation. It uses software “bots” to click through screens and move data across systems, like a human would. AI is useful when the task involves language, patterns, or judgment support. Example: reading an email, identifying intent, drafting a response, or summarizing a case. Intelligent automation often combines both. Rules handle what should be predictable. AI helps with what is messy. Controls keep it safe. Challenge 1: Teams automate too early, before the workflow is truly understood Many teams start with tools. They should start with the work. If you do not understand the workflow, automation will amplify confusion. It will move faster, but in the wrong direction. What “not understood” looks like: What to do instead: A quick test: if you cannot explain the workflow in one page, you are not ready to automate it. Challenge 2: Data issues break AI and automation faster than anything else [Image: Data pipeline from multiple systems into a single “clean view” | Alt: Data quality and access for AI ] AI needs data. Automation needs data too. Poor data is the silent killer. This problem usually has three parts. 1) Data quality If records are incomplete or inconsistent, the system will make bad decisions. “Bad in, bad out” is real. 2) Data access Even if the data exists, your system may not be allowed to access it. This is common in regulated environments. 3) Data meaning Two systems may use the same field name but mean different things. That creates logic errors and wrong outcomes. What to do instead: If your AI cannot explain what it used and where it came from, you will struggle with trust later. Challenge 3: The solution is built outside real workflows, so adoption stays low A separate portal is a common mistake. People do not want “one more tool.” They want less work inside the tools they already use. When AI and automation live outside daily workflows, three things happen: What to do instead: This is also why platform work matters. Many teams want automation that works inside major platforms, not next to them. Challenge 4: People and change management get ignored, then everything stalls Teams often treat implementation as a technical project. It is also a people project. Even strong automation fails if: What to do instead: A helpful mindset: adoption is part of the system design, not a separate rollout task. Challenge 5: Governance and compliance are treated as paperwork, not as product design If your system touches customer operations, governance is not optional. Good governance answers simple questions: Frameworks like the NIST AI Risk Management Framework focus on building “trustworthy AI” through structured risk management. This includes governance practices and ongoing measurement, not just model building. (NIST) Also, regulation is moving toward risk-based expectations. The EU’s AI Act is built around risk levels, with stricter rules for higher-risk uses. (Digital Strategy) What to do instead: If you are using generative AI, treat it with extra care. NIST has a dedicated companion profile for generative AI risk management, which highlights why testing and controls matter. (NIST Publications) Challenge 6: Security and privacy get handled late, and delays pile up [Image: Security checklist with access controls, encryption, logging | Alt: Security and privacy for automation ] Security teams do not block projects because they dislike innovation. They block projects because unclear systems create risk. This is where many projects get stuck: Standards like ISO/IEC 27001 exist because security needs a management system, not just tools. (ISO) And modern privacy laws, including GDPR principles, emphasize integrity and confidentiality of personal data. (GDPR) What to do instead (simple version): This is not “extra work.” It prevents months of delay. Challenge 7: Scaling breaks because there is no “run” plan after go-live [Image: Monitoring dashboard with alerts and error rates | Alt: Operating model for AI systems ] A pilot is not a production system. Production needs an operating model. That means: Without this, small issues turn into bigger failures: What to do instead: A good rule: go-live is the start of ownership, not the end of delivery. Challenge 8: ROI is measured poorly, so leadership loses confidence [Image: Simple ROI model with time saved, error reduction, and cost | Alt: Outcome metrics for automation ROI ] Many teams use vanity metrics because they are easy: These do not prove business value. Better outcome metrics (pick 3 to start): A simple ROI model (easy and honest): This keeps the conversation grounded. A practical “ready for implementation” checklist [Image: Checklist page with boxes ticked | Alt: AI and automation readiness checklist ] Before you scale beyond a pilot, you should be able to answer yes to most of these: Workflow clarity Data readiness Controls Operations If you cannot answer these, the project may still succeed, but it will be slower and riskier. A simple implementation plan you can follow (30 to 90 days) [Image: Timeline with Discover -> Build -> Run -> Improve | Alt: 30-60-90 day plan for

Intelligent Automation
Blog

Intelligent Automation: Practical Trends Shaping the Future of Work

A vendor put a number in front of a finance director last spring: 82 percent of invoices would go straight through, untouched. Sixty thousand invoices a year, eleven minutes each by hand. The arithmetic on the slide came out at four hundred and sixteen thousand dollars of freed labour against a hundred and fifty-two thousand of annual cost. A hundred and seventy-four percent return. The number was not dishonest. It was incomplete in three specific places, and each of the three maps onto one of the trends everybody is writing about this year. That is the useful way into intelligent automation: not as a list of capabilities, but as a list of things that each generate work someone has to absorb after go-live. What intelligent automation actually is Intelligent automation is the combination of rule-based automation, robotic process automation (RPA), machine learning models, and workflow orchestration, applied to a single business process end to end. RPA is software that drives existing applications the way a person would, through their screens and interfaces. Orchestration is the layer that decides what happens next and who gets involved. The definition needs no citation because it is a description, not a claim. What needs a citation is the origin of the word everyone reaches for next. Trend one: hyperautomation, and the discipline it was defined with Gartner introduced hyperautomation as its first of ten strategic technology trends for 2020, in research published on 21 October 2019 by David Cearley, Nick Jones, David Smith, Brian Burke, Arun Chandrasekaran and CK Lu. The definition is more demanding than the way the word gets used now. Gartner described hyperautomation hyperautomation as the combination of multiple machine learning, packaged software and automation tools to deliver work, and specified that it refers “not only to the breadth of the pallet of tools, but also to all the steps of automation itself (discover, analyze, design, automate, measure, monitor and reassess).” Read that list of steps again. Three of the eight are things you do after the automation is running: measure, monitor, reassess. Gartner also said plainly that “RPA alone is not hyperautomation.” So the term that gets used to mean more automation was defined to mean automation plus a measurement and reassessment loop. Most programmes buy the first half. The reason this matters for the invoice model is that the vendor’s 82 percent touchless rate assumed the remaining 18 percent would still take eleven minutes each, the same as before. Exceptions do not work that way. When the clean cases leave the queue, what remains is the hard residue, and it takes longer per item than the blended average ever did. Trend two: AI-assisted workflow, where the exception rate is the whole story Rule-based automation fails loudly. A rule either matches or it does not. AI-assisted workflow fails quietly: it produces an output that is well-formed, plausible, and wrong, and nothing in the pipeline objects. That is why the observed exception rate, not the touchless rate, is the number the business case turns on. In the invoice case the real figure after four months of production was 26 percent, not 18, and those exceptions averaged fourteen minutes each rather than eleven, because the residue was the awkward supplier formats and the partial deliveries. Here is the whole model, and it is illustrative. Substitute your own figures; what is being shown is the shape of the calculation, not a price list. Sixty thousand invoices a year. Eleven minutes each by hand. Labour rate derived from a fully loaded cost of $71,000 for a processor, divided by productive hours rather than paid hours: 2,080 paid hours less 26 percent shrinkage for leave, training, sickness and non-productive time gives 1,539.2 productive hours, so $46.13 an hour. Baseline: 11,000 hours, or $507,406 a year. After go-live, at a 26 percent exception rate and fourteen minutes per exception, exception handling consumes 3,640 hours. Freed hours: 7,360, worth $339,501 at the processor rate. Annual cost: build of $210,000 amortised over a three-year life is $70,000, plus $58,000 of licence share and $24,000 of support and maintenance. Total $152,000. Those are plausible market rates for a programme of this size rather than quotes from a specific price list, and should be treated as such. Then the part the vendor slide did not have, which is the subject of the next two trends. Trend three: low-code and no-code, and the inventory nobody is keeping Low-code and no-code platforms let people who are not developers build working applications. Gartner’s 2019 research called this democratisation of expertise and predicted it would accelerate through 2023, including “democratization of design (expanding on the low-code, no-code phenomena with automation of additional application development functions to empower the citizen-developer).” That happened. What it produces is an asset class with no owner. The Open Web Application Security Project, a vendor-neutral non-profit, maintains a Top 10 for exactly this, and its ninth entry, asset management failures, describes the mechanism better than any vendor page will: citizen-developed applications “are prone to being forgotten or abandoned while remaining active and functional,” and useful internal applications “become widely shared within the organization, scaling rapidly in usage and dependency without the necessary business continuity measure expected of more standardized and essential systems such as having designated owners, IT monitoring, or a Service Level Agreement (SLA).” Note what that is not. It is not a security-scare argument. It is an operations argument with a cost attached: something that is running, that people depend on, that nobody is named against. In the invoice programme there were 34 such assets by month four, and keeping an inventory current, with an owner name and a last-reviewed date against each one, took about nine hours per asset per year. 306 hours, at a reviewer rate of $67.57 an hour derived the same way from a $104,000 fully loaded cost. The counter-metric here pairs naturally: count assets built alongside assets with a named owner and a review date inside the last quarter. The first number

Emotion Recognition In Customer Service -Feature Img
Blog

Emotion Recognition in Customer Service: What the Score Actually Measures

Two people can use the phrase “emotion recognition” in the same meeting and mean incompatible things. Under European law it has a narrow, technical meaning. Regulation (EU) 2024/1689, the European Union’s AI Act, defines an emotion recognition system as one that infers emotions or intentions on the basis of biometric data, and biometric data means data resulting from technical processing of physical, physiological or behavioural characteristics. The recitals draw the line further in. The concept covers emotions such as happiness, sadness, anger and shame, and expressly excludes physical states such as pain or fatigue, along with the “mere detection of readily apparent expressions.” Inside a contact centre platform, the thing on the dashboard is usually something else entirely. It reads the transcript. It looks for words and phrases. It scores them. Those are two different systems, with two different failure modes and two different regulatory positions, and the gap between them is where most emotion-analytics programmes go wrong. Not because anyone lied, but because the buyer bought the first definition and got the second. This piece works through what the score is actually made of, what a wrong score costs, and the accuracy level below which the whole exercise loses money. Claim one: “it hears the frustration in their voice” Check this one first, because it is the claim buyers repeat internally and the one most likely to be false. NICE’s own Key Terms and Metrics documentation for Interaction Analytics (CXone) states it twice, unambiguously. Of sentiment: “Sentiment scores are not influenced by voice characteristics, such as tone, volume, and speed.” Of frustration: “Frustration cues are not influenced by voice characteristics, such as tone, volume, and speed.” That is the platform partner describing its own product the platform partner describing its own product. So the score is a language score. It matches cues in the transcript, phrases such as “I want to speak to your manager,” “This is the third time I’ve called,” “I’m sick and tired of this,” “I’m not happy about the delay.” A customer who says none of those things in a flat, resigned voice scores neutral. A customer who says all of them cheerfully scores frustrated. Three consequences follow directly, and none of them are visible in a demo. The transcript is the ceiling. Everything downstream inherits speech recognition quality. Where recognition confidence is low on a given call, the cue match degrades before the score does, and the score does not report that it happened. This is the same dependency chain that governs automated call summaries automated call summaries, and it fails in the same direction. Frustration and sentiment are not the same instrument. Per the same documentation, frustration measures cues for the client only, while sentiment can measure cues for both the client and the agent. The relationship between them is asymmetric: all frustrated interactions should also be negative, but negative sentiment does not always correlate with frustration. Treat the two as interchangeable in a report and you produce numbers that cannot be reconciled with each other. The window matters more than the score. Beginning Sentiment is determined by the first 400 words or the first 30% of the interaction, whichever comes first. End Sentiment is determined by the last 30%. Neither can return a Mixed value. A call that opens badly and ends well produces a specific pair of values, and a report that averages them has destroyed the only interesting thing in the data. Claim two: “the number tells you the customer is angry” It tells you cues appeared and were weighted. Those are different statements. Sentiment is calculated by applying specific weights to each cue, described in the documentation as overwrite, strong, weak and yield. An interaction can therefore be categorised as Mixed even when the raw count of one cue type is significantly higher than the other. The score is not a tally. Anyone who builds a report on the assumption that more negative phrases produce a more negative score will find cases that contradict them and will have no way to explain why. The documentation is also honest about attribution in a way internal reporting rarely is. Negative sentiment does not have to mean there is a problem with agent performance or behaviour. It can stem from a product issue, a billing challenge, or an event entirely outside the agent’s control. That single sentence should govern how the metric is allowed to be used. A frustration score attached to an agent’s name, on a dashboard a team leader reviews weekly, is substantially a measurement of the queue that agent was given. Independent research points the same way. In work presented at the 2021 Affective Computing and Intelligent Interaction conference, researchers from Microsoft and Stanford observed that tools traditionally used by domain experts are now used by individuals often unaware of the technology’s limitations and in potentially harmful settings, and proposed twelve guidelines for systematically assessing and reducing that risk. The most useful one for a contact centre is also the least technical: be explicit about what the output is not evidence of. Claim three: the honest arithmetic of a false flag A frustration flag has no value on its own. Value appears only when someone does something differently because of it, and the doing costs money whether or not the flag was correct. So the useful model here is not a savings model. It is a model of what it costs to be wrong, and how often you can afford it. The scope, stated tightly The figures below are illustrative. They are shaped to be plausible rather than taken from any engagement, and the labour costs and licence share are market-shaped assumptions rather than price-list entries. Substitute your own numbers. What is being demonstrated is the shape of the calculation and the thresholds it produces, not the result. One line of business. 40,000 inbound interactions a month, 6% carrying frustration cues, so 2,400 flagged interactions. Every flagged interaction gets a four-minute analyst review before anyone acts on it. Confirmed cases

How Ai Improves Contact Centers With Speech-To-Text Summaries
Blog

How AI Improves Contact Centers With Speech-to-Text Summaries

[Image: An agent on a call, with a simple “Call summary” panel in their desktop UI | Alt: Speech-to-text call summarization in a contact center ] A contact center call ends. The customer is gone. The real work starts. The agent has to remember what happened, type notes, pick a disposition, update the CRM, and make sure the next person who touches the case can understand it. When volume is high, this “after-call work” becomes a silent tax. Notes get rushed. Details get missed. Follow-ups get delayed. Quality teams spend hours searching recordings. This is where speech-to-text summarization helps. Speech-to-text means converting the call audio into text. Summarization means turning that text into a short, structured summary that captures what matters: why the customer contacted you, what the agent did, what was promised, and what happens next. Many contact center platforms and AI services now support this, including NICE CXone AutoSummary, which can generate summaries and place them into agent notes and pass them into supported CRM tools. (Nice inContact Help Center) This is not “AI for the sake of AI.” It is a practical way to reduce manual typing, improve consistency, and make call history easier to use. What speech-to-text summarization is, in simple terms [Image: A simple diagram: Call audio -> Transcript -> Summary -> CRM notes | Alt: Speech-to-text summarization workflow for contact centers ] Speech-to-text (STT) converts spoken words into written text. Summarization turns the transcript into a shorter version that keeps the important parts. In contact centers, summaries usually include: Some systems do this after the call (post-call). Others support near real-time support while the call is happening, usually as part of agent assist. You can implement this using platform features (for example, CXone AutoSummary) or using AI services that provide transcription and call analytics outputs via API. (Nice inContact Help Center) Why this matters now in real operations [Image: A busy contact center floor with “peak volume” on a dashboard | Alt: High-volume contact center operations and after-call work pressure ] Most contact centers are not struggling because agents cannot talk to customers. They struggle because: Speech-to-text summaries reduce friction at the exact point where work tends to pile up: right after the interaction. When this is implemented well, the goal is not to replace judgment. The goal is to give teams cleaner, faster documentation so humans can spend time where it matters. What improves when summaries are done well [Image: A “Before vs After” panel: messy notes vs clean structured summary | Alt: Contact center notes improvement with AI summaries ] 1) Less after-call work, more focus during the call When an agent does not need to type everything from memory, they can stay present with the customer. They also spend less time cleaning up notes after the call. In NICE’s description of call summary automation, the point is operational consistency and reducing manual effort, using NLP and speech analytics to produce human-readable summaries. (NiCE) 2) Better handoffs between agents and teams A strong summary helps the next agent avoid asking the customer to repeat everything. It also helps back office teams understand what happened without replaying audio. This is one of the most underrated benefits: summaries turn call history into something teams can actually use. 3) Faster quality reviews and coaching Quality teams often sample calls, review notes, and look for patterns. With summaries, supervisors can scan more interactions quickly and decide which calls need deeper review. Many contact center analytics tools already support using interaction data for trend and sentiment analysis, and in CXone Interaction Analytics you can route and analyze interactions based on signals like sentiment and frustration. (Nice inContact Help Center) 4) More consistent documentation, which helps compliance In regulated environments, you need to know: What was said? What was promised? What was done? A summary is not the same as a legal record. But it can support consistent note-taking and review when paired with proper logging, access controls, and retention policies. What this does not solve by itself [Image: A warning icon next to a summary that says “Needs review” | Alt: Human review for AI-generated call summaries ] Speech-to-text summarization is helpful, but it is not magic. It will not fix: Summaries work best when the workflow is defined and the “rules of the road” are clear. Two ways teams usually deploy it [Image: Split screen showing “Platform feature” vs “API pipeline” | Alt: Two deployment options for call summarization ] Option A: Use built-in platform features Some platforms provide summarization inside the agent desktop and notes flow. For example, CXone AutoSummary generates a summary at the end of an interaction and places it in agent notes, and it can be passed to a supported CRM and used in Interaction Analytics. (Nice inContact Help Center) This is often the fastest path because it is already integrated into the workflow. Option B: Build an AI pipeline with APIs Some teams use services like Amazon Transcribe Call Analytics to generate transcripts and insights designed for call audio, then use summarization capabilities on top. (AWS Documentation) This is useful when you need custom formats, multiple languages, special routing logic, or integration across several systems. A practical example of what “good” looks like [Image: A sample summary template with sections: Reason, Actions, Outcome, Follow-up | Alt: Call summary template for agents ] Here is a simple example format many teams find useful: Reason for contact: Customer reports delivery delay for order #12345 Customer goal: Wants updated delivery date and confirmation Agent actions: Checked order status, confirmed delay due to stock, offered expedited shipping Resolution: Customer accepted expedited option Follow-up: Email confirmation sent, ticket set to “Pending delivery” Notes: Customer requested delivery before Friday, high importance Notice what is missing: long paragraphs. A good summary is short, structured, and easy to scan. What to watch out for, so this does not backfire [Image: A checklist titled “Common risks” | Alt: Risks and pitfalls of AI call summarization ] 1) Accuracy and

Intelligent Automation In The Legal Sector, Practical Use Cases And Sage Adoption
Blog

Intelligent Automation in the Legal Sector: Practical Use Cases and Safe Adoption

A statement of work crossed our desk last year with a line in the scope section that read, in full: “Automate the contract intake process.” No volumes, no definition of intake, no statement of where the process started or stopped. It had been signed by both parties. That line is not unusual, and it is not really about contracts. It is about a category error that runs through most legal automation projects. “Intake” in that firm turned out to be seven separate waits: a business unit emailing a shared mailbox, someone opening the mailbox, someone deciding which reviewer it belonged to, the reviewer opening it, the reviewer asking for the missing counterparty details, the business unit answering, and the reviewer picking it up again. Almost none of the elapsed time was work. Nearly all of it was waiting for the next person to look. That distinction decides which legal workflows are worth automating first, and it is the organising idea of everything below. What intelligent automation means in legal work Intelligent automation is the combination of three things that used to be bought separately. Rule-based automation, usually called RPA (robotic process automation), moves data between systems and performs deterministic steps. Document intelligence reads a file and extracts structured fields from it. A model, increasingly a generative one, drafts or classifies or summarises. Orchestration decides which of these runs, in what order, and when a human is required. In legal work the useful framing is narrower than the vendor framing. Intelligent automation does not replace legal judgement, and any description of it that implies otherwise should be treated as a sales artefact. What it does is remove the steps between judgements: the routing, the chasing, the copying of the same eight fields into a third system, the assembling of the pack that a reviewer needs before the reviewer can think. Two acronyms recur below and are worth fixing now. ESI means electronically stored information, the term the discovery process uses for anything that lives in a system rather than on paper. GAI means generative artificial intelligence, which is the term the American Bar Association uses in its ethics guidance, so it is the term used here when discussing that guidance. Sort your use cases before you cost them The six workflows legal teams usually shortlist are not one category. They divide cleanly by what is actually holding them up, and the division changes both the business case and the risk posture. 1 Queue-bound work. The elapsed time is dominated by waiting for the next person to look at it. The work itself is short and largely uncontested. Automation here removes handoffs, and removing a handoff removes a wait, which is why the gain is large and shows up in days rather than minutes. Intake and triage, compliance evidence assembly, status communication to requesters and stakeholders, and matter reporting and billing preparation all sit here. 2 Judgement-bound work. The elapsed time is dominated by someone reading carefully. Automation here does not remove the reading; it changes what the reader is given. That can be a real gain, but it arrives with a verification obligation attached, and the verification is new work that did not exist before. Substantive contract review and discovery review sit here. The practical consequence is uncomfortable for pilot selection. Judgement-bound work is more interesting, demos better, and is what most vendors lead with. Queue-bound work is where the first measurable win lives. A programme that starts with contract review because it is impressive, rather than with intake because it is slow, tends to produce a well-received demonstration and no defensible number. The four queue-bound candidates Intake and triage. A request arrives, and something decides what it is, whether the mandatory information is present, which reviewer or queue it belongs to, and what the counterparty and value bands are. Where information is missing, the requester is asked automatically rather than after a reviewer notices. This is the single highest-yield legal automation in most organisations and it involves no legal judgement at all. Compliance tracking and evidence assembly. Obligations with dates attached, and the evidence that each was met, collected as the work happens rather than reconstructed before an audit. GDPR is explicit that this is the controller’s job rather than a nice-to-have: Article 5(2) states that the controller “shall be responsible for, and be able to demonstrate compliance with” the processing principles, and Article 30 sets out what the record of processing activities must contain and requires it to be made available to the supervisory authority on request. Stakeholder communication. The requester is told where their agreement is without anyone being asked. Most of the chase traffic in a legal inbox is not a request for work; it is a request for status, and status is a field, not a judgement. Matter reporting and billing preparation. Time, stage and volume data assembled into the shape the finance function and the client actually need, rather than reassembled by hand at month end. The two judgement-bound candidates 1 Contract review support. The system extracts the terms that matter (term length, renewal mechanics, liability cap, indemnity, governing law, termination triggers, data-protection clauses) and compares them against a playbook position. It does not approve anything. Its output is a reviewer’s starting position, which the reviewer then has to check, and the checking is real work. This distinction matters enough that it reappears in the model below. 2 Discovery support and legal holds. Custodian identification, hold notices, acknowledgement tracking and volume reduction before review. It is worth being accurate about what the reference model here actually says, because the sequence is often described as a pipeline and it is not one. EDRM (EDRM.NET) states plainly that its diagram “represents a conceptual view of the e-discovery process, not a literal, linear or waterfall model”, that “one may elect to carry out the steps in a different order than shown here”, and that the process is iterative: “one might repeat the same step numerous times, honing

Contact Center Automation -Feature Img
Blog

Automation for the Contact Center: Practical AI and Workflow Transformation

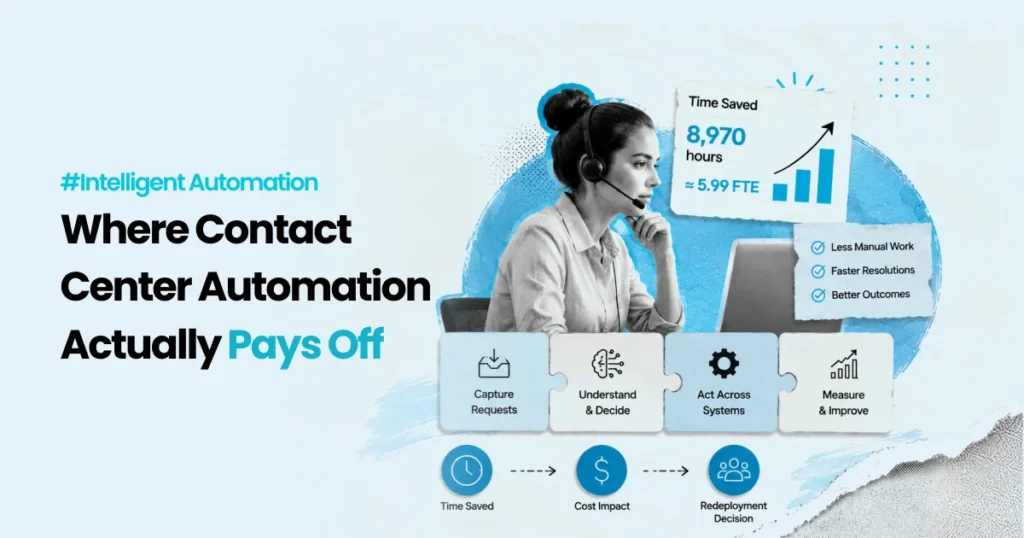
One and a half minutes. That is what generated summaries take off the after-call work on a single voice contact in the model further down this page. It sounds too small to chase. Across a sixty-seat operation handling 358,800 contacts a year it comes to 8,970 hours, which is just under six full-time equivalents. Six people’s worth of time, and none of it is money yet. It becomes money only if somebody decides in advance what those six people will do instead, and then makes sure it happens. That decision is usually nobody’s job. It is the reason contact centre automation programmes report savings finance cannot find, and it is the thread running through everything below. So this is not a tour of features. It is the work ordered by where the money actually is, the four places it gets stuck, and the three numbers that decide whether any of it pays. Start where the time goes, not where the demo starts Vendor demonstrations open with the conversational interface, because that is the part that looks like the future. Cost sits somewhere less impressive: in the minutes after the customer has hung up, and in the manual steps between systems that nobody designed and everybody works around. That mismatch is the first decision, and getting it backwards is expensive. Front-end automation touches every contact and carries reputational risk on each one. Back-end automation touches the same volume with almost none, because the customer has already gone. If you are going to be wrong somewhere, be wrong where the customer cannot see it. One caution before picking a target, and it is the reason to map the work before shortlisting tools. Occasionally the workflow that scores highest on automatability is holding up something that is not operational at all: a compliance record, an audit trail, a judgment call that someone downstream depends on being made by a person. Automating it improves every figure on the dashboard and quietly removes the thing the business was relying on. No dashboard can show you that trade, which is why somebody has to go looking for it while the build is still cheap to cancel Map one high-volume workflow end to end before anything else: the trigger, the systems it crosses, the decisions a human makes and why, the exception paths, and the steps where being wrong causes harm. Teams that do this honestly all report the same finding. The pain is concentrated in the glue between systems, not in the systems themselves. The four seams where contact centre work gets stuck Work does not get lost inside systems. It gets lost passing between them, and between the people and software either side of a handoff. There are four such seams in a contact centre. Each one has automation worth doing, a way that automation flatters itself, and something specific you can sample to find out which is happening. Seam one: intake, and the handoff out of it Customers like self-service when it resolves the thing. They hate it when it holds them. Virtual agents handle status checks, policy questions and basic troubleshooting well; knowledge search works when it matches the customer’s own words rather than the taxonomy your content team built. The stakes at this seam are rising on a documented timeline. Gartner’s published guidance on customer service artificial intelligence (AI) states that by 2028, at least 70% of customers will use a conversational AI interface to start their customer service journey. Read that as a claim about the front door, not about resolution. If most journeys will begin in a conversational interface, the quality of the exit from that interface becomes the thing that determines customer experience. Which means the escalation rules are the design, not an afterthought. Define the triggers explicitly: the customer asks for a person, confidence is low, the same step fails twice, or the intent carries risk such as a billing dispute, a legal request, or anything medical. When escalation fires, the agent should receive what the customer already tried, what the bot already told them, and what data was already captured. Most failures blamed on the bot are failures of what did not survive the handoff How this seam flatters itself: containment. A contact that resolves nothing but produces a callback tomorrow is not contained, it is postponed, and postponement and resolution look identical on a containment dashboard. Read containment only ever alongside repeat contact rate inside 72 hours. What to sample: fifty escalated contacts, checking whether the agent could see the bot transcript without asking the customer to start again. Seam two: the routing decision Routing is not only which agent answers. It is a sequence of decisions about channel, queue, priority, skill match and what happens next. Automation earns its place in intent detection, where even coarse classification stops “I want to change my delivery address” landing in general support; in skill matching; in priority rules for regulated complaints, account security and time-critical delivery problems; and in load balancing, so a queue spike does not need a supervisor watching it. How this seam flatters itself: routing accuracy. Aggressive skill-based routing raises first contact resolution on the contacts it classifies correctly while generating transfers on everything it does not, and the two effects can cancel out while both dashboards look busy. Pair routing accuracy with transfer rate and read them as one number. What to sample: every transferred contact for one week, sorted by the intent the classifier assigned. The misroutes cluster, and the clusters are fixable. Seam three: the agent’s desktop Most leaders talk about deflection. Several of the largest wins come from supporting the person instead: customer context, recent history, the relevant policy line, the next best action, a draft reply. Less searching, fewer mistakes, more consistency between agents. One rule outranks the feature list. Assistance has to appear inside the application the agent already has open. A second window is a tax, and agents will route around a tax. How this seam flatters itself: average handle time (AHT). Time falls

Pateam Launch -Feature Img
Blog

PAteam Launch: A New Look for the Work We Do Today

Smarter AI. Better CX. Seamless Automation. We are now live with our refreshed brand. It is not a reinvention. It is a clearer reflection of who we are now, and what we deliver day to day. PAteam has spent nearly a decade building systems that keep real operations moving. The kind of work that does not look flashy, but makes a measurable difference when volume rises, when exceptions pile up, and when teams need stability. For a long time, our delivery grew faster than our public story. This update brings them back into alignment. Where we started, and what we learned early PAteam began with a clear problem: too much important work was trapped in manual steps. Not because teams lacked talent, but because systems did not connect well. People had to act as the integration layer. They copied data from one tool to another. They reconciled reports by hand. They handled the same exceptions again and again. They chased approvals across inboxes. They kept service levels alive through effort. RPA became a natural foundation for us. RPA, robotic process automation, uses software bots to perform repeatable steps across systems. The best RPA work is not about replacing people. It is about removing the repetitive, high-friction steps that slow teams down and create errors. Those early years also shaped our standards: Build for real operations, not demos. Design for edge cases, not just the happy path. Make ownership clear after go-live. Focus on outcomes, not vanity metrics. We did not always write those principles down. We learned them through delivery. The work expanded as the world changed As the market evolved, two things became clear. First, enterprises started putting more of their critical workflows inside major platforms. In customer operations, that platform is often NICE CXone. Second, AI became more practical. It moved from experimentation to real workflow support, especially in tasks involving language, triage, and decision support. So our work expanded, in a very natural way. We still deliver RPA. It is still a core strength. We also build agentic AI workflows. These are workflows where AI can understand a request, take guided steps, and use tools to complete tasks, within clear boundaries. And more of our delivery now happens inside NICE CXone environments, not beside them. That is why becoming a NICE CXone partner matters. It reflects the role CXone implementation and optimization now plays in what we do. None of this is a hard pivot. It is an evolution. It is the same delivery mindset applied to modern systems. Agentic AI, explained simply Agentic AI can sound complicated, but the idea is straightforward. In many workflows, teams need three things: Sort incoming requests quickly. Respond consistently. Take the right next action in the right system. Agentic AI supports exactly that. A well-designed agentic workflow can: triage requests into categories, draft responses using approved guidance, pull context from a CRM or another system, take safe actions like generating links or updating records, escalate to a human when risk is higher. The key is the design. Agentic AI works when it is built into a workflow with controls. It fails when it is treated like a magic shortcut. This is where our foundation in automation matters. We have seen what breaks in production, and we build with that reality in mind. Why the brand needed to reposition Many people met PAteam through one door. Some met us through RPA. Some met us through CX work. Some saw automation and assumed one narrow use case. That is normal. Most websites give you the first chapter, not the full story. This refresh makes the full scope easier to see. We are now presenting PAteam through three clear service lanes: CCaaS – Delivered through CXone RPA services Agentic AI services across industries and domains If you only knew one part of that, you will now see the full map. Not because we want to sound bigger, but because clarity helps buyers, partners, and teams make faster, better decisions. Getting the fundamentals right As we expanded our scope, we made a choice. We do not want to market more. We want to explain better. That starts with fundamentals. Run inside the tools teams already use The best systems do not force people into a separate portal. They run where work already happens, inside CXone, inside CRMs, inside enterprise tools. This improves adoption. It reduces training load. It also makes automation feel like part of operations, not a side project. Design for messy cases, not ideal cases Most workflows look clean on paper. Real operations are not clean. Exceptions decide whether a system is trusted. Missing data. Unclear intent. Policy edge cases. System downtime. High-risk situations. If you do not design for those cases, automation becomes fragile. It creates more work instead of less work. So we design escalation and exception paths from day one. Make decisions traceable If a system takes an action, teams need to answer: What happened? Why did it happen? What information was used? Who approved it, if approval was required? This is what audit trails are for. They are not bureaucracy. They are control. Treat go-live as the start of ownership Many automations fail after launch, not during build. They fail because nobody owns the system, nobody monitors it, and small issues compound until the workflow stops being reliable. A real operating model includes: monitoring and alerts, escalation paths, change control, tuning over time, clear support responsibility. These are not “extras.” They are what make systems durable. This is also why our new story focuses on fundamentals. It is what serious operators look for. The proof is in the environments that raise the bar PAteam has had the opportunity to work with demanding teams and high-standard environments, including organizations like FedEx and work connected to MIT-level standards. We mention this carefully, and with humility, because logos are not the point. The point is what those environments teach you. They teach you that reliability matters more than novelty. They

Embracing Ssd Automation To Improve Disability Benefit Processes
Blog

Embracing SSD Automation to Improve Disability Benefit Processes

For the person applying, a disability decision is rent, heating, medication, and stability. For the firm representing them, it is a file that has to be moved through a federal process that does not reward speed and does not pay for effort. Those two facts sit on top of each other, and the second one is where the operational problem lives. The economics are fixed at the top A representative’s fee in an SSD case is set by statute, not by the market. Under $404.1730 of SSA’s regulations, where SSA makes a favourable determination and past-due benefits result, it pays the representative the smaller of twenty-five percent of total past-due benefits or the fee it sets, less an assessment capped at 6.3 percent. The dollar ceiling on that calculation rose to $9,200 effective 30 November 2024, announced in SSA’s Federal Register notice of 10 May 2024. There is a detail here that most commentary has not caught up with. That 2024 notice also committed SSA to publishing an annual notice from January 2026 explaining whether it was raising the cap or holding it. SSA rescinded that commitment in a partial rescission published 6 May 2025, retaining the $9,200 figure but stating it will now publish only when it increases the cap, on the grounds that an annual notice regardless of outcome imposes administrative burden the Act does not require. Read that as an operator rather than a lawyer. The ceiling is fixed, the twenty-five percent rule means the cap binds only once past-due benefits reach $36,800, and there is no longer a scheduled annual signal that the ceiling might move. A firm planning capacity cannot assume the revenue line rises on a timetable. It rises when caseload rises, which means the only reliable lever on margin is cost per case. That is the whole reason automation belongs in this conversation, and it is a narrower reason than most vendors offer. This is not about doing law better. It is about the administrative work stacked around the law, which the fee schedule never priced separately and which grows in direct proportion to volume. The wait is getting longer, and not smoothly SSA publishes combined disability processing time by fiscal year, and the trend is unambiguous. Its combined disability processing time series records 110 days in FY2016, rising to 120 by FY2019, then 165 in FY2021, 217 in FY2023, and a peak of 231 in FY2024. FY2025 came in at 226. The first nine months of FY2026 average 192. The honest reading of the recent monthly data is more interesting than the one usually offered. Within FY2026 the monthly figures move from 204 in October down to 184 by May, then back up to 185 in June. December to January also rose, from 193 to 194. The direction over the year is downward, but it is not a steady decline, and anyone describing it as one has not opened the monthly file. That distinction matters operationally: a firm sizing its pipeline against a smooth improvement curve will get its staffing wrong in the months where the line turns. One caveat belongs in the reading rather than in a footnote. SSA’s own denominator language defines this as processing time for cases with a decision in the period, which means it describes cases that finished, not cases still waiting. Improvement in the series is consistent with faster closure of a favourable mix as well as with genuine throughput gains. Where the administrative load actually sits Three places, and they are not the ones a partner usually names first. 1 Medical evidence handling. A case file accumulates records from every provider a claimant has seen, arriving as scans, faxes, portal downloads, and mail, in no consistent format. Someone opens each one, identifies what it is, extracts the dates and provider and findings that matter, and files it against the right case. In a firm running six thousand cases a year, that is the single largest consumer of non-attorney time. 2 Government portal work. SSA’s systems for representatives are functional and they are not built for scaled operations. Retrieving status, submitting evidence, and pulling hearing information all require session-based access, and the authentication model assumes a person at a keyboard rather than a queue of work. The constraint compounds: a firm cannot parallelise portal work by adding staff the way it can parallelise document review, because the bottleneck is the session, not the reviewer. 3 The technical denial category. Some claims fail for reasons that have nothing to do with medical severity, and SSA’s disability determination process is explicit that the field office screens non-medical requirements before the file reaches Disability Determination Services at all. Those are the cheapest failures to prevent and the most expensive to discover late. There is also a fast lane, and it is smaller than firms assume. SSA’s Quick Disability Determination model flags cases likely to be allowed on medical evidence alone, and its fast-track receipts data shows 180,116 of 2,155,574 national DDS electronic receipts in FY2024 were fast-tracked, which is 8.40 percent. That is up from 4.20 percent in FY2010, so the mechanism is real and growing. It is also unevenly distributed: 5.80 percent in the District of Columbia and 6.10 percent in Louisiana against 11.40 percent in Alaska and 12.90 percent in New Hampshire. A firm with a national caseload cannot plan on a single fast-lane rate, because its effective rate is a function of where its claimants live. Why scripted automation keeps failing here Most firms that have tried automation have tried rules-based robotic process automation, and most have been disappointed. The reason is structural rather than a matter of poor implementation. Scripted automation assumes that the thing arriving looks the way it looked last time. It works from screen positions, field labels, and fixed document layouts. SSD document flow violates that assumption constantly, because the format is set by whichever provider generated the record, not by the firm receiving it. A script built against one hospital’s

Scroll to Top